Models with memories: The Beauty of Multilevel Models
Multilevel models go by many names—hierarchical models, mixed-effects models, varying-intercept models—but one of the most beautiful labels comes from Richard McElreath in Statistical Rethinking: Models with Memory.
This phrase does more than sound poetic—it captures something deep and intuitive. Like humans, these models can remember. They retain traces of past observations, using them to shape expectations about new, unseen cases.
This blog post isn’t about proving mathematical theorems or deriving likelihoods. Instead, it’s a story about how these models work because they remember, and how that memory can be both powerful and problematic.
🧠 Why Memory Matters (In Models and in Life)**
Imagine visiting a brand-new café. Even if you’ve never been there, you already have an estimate of what to expect—the wait time. Your brain has pooled experiences from other cafés to inform your judgment. (Example from Statistical Rethinking)
Now think about meeting a new friend. You don’t go in completely blind—you instinctively draw on your past encounters with others. You might pick up on familiar social cues, patterns of conversation, or shared interests. Even though it’s a new connection, your past experiences shape how you engage. That’s memory in action too—subtle, cumulative, and incredibly useful.
In contrast, people living with memory-related conditions like dementia or amnesia face difficulties because they can’t retain or recall essential context. Having witnessed this firsthand through a grandparent, I’ve come to appreciate just how vital memory is for making sense of the world. It provides continuity, security, and a foundation for meaningful interaction.
Multilevel models operate in a similar way. They “remember” patterns from previous data—especially from similar groups—and use that accumulated knowledge to inform predictions in new or less certain cases.
But teaching this kind of memory to machines? That’s a bit tricky. Machines don’t remember the way humans do. Instead, we have to engineer memory—carefully encoding it through priors, pooling strategies, and model assumptions. This allows the model to “borrow strength” from related groups without overreaching or distorting the data.
We’ll walk through exactly how that works in the next example.
🧪 Example: The Eight Schools Dataset (Gelman et al.)
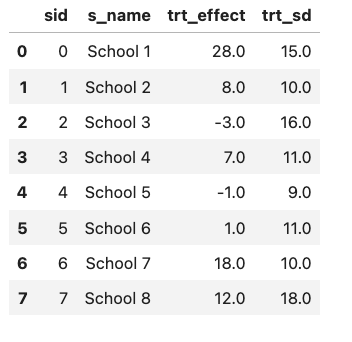
This dataset comes from a study evaluating the effects of a coaching program designed to improve SAT scores across eight different schools in the U.S.
Each school reports an estimated treatment effect (how much scores improved after the program) along with a standard error. But there’s a catch: the schools vary significantly in both effect sizes and uncertainty. Some report large gains, others modest or even negative ones, and the sample sizes are small—leading to a noisy picture.
🧮 Just Show Me the Model
Sometimes multilevel models can be confusing—not because the core idea is all that complex, but because they come with a whirlwind of different names: hierarchical models, mixed-effects models, random effects models, varying-intercept models, and more. In fact, Andrew Gelman, in one of his well-known paper, included an entire section just to untangle the many labels surrounding fixed and random effects and how they’re used.

In the Eight Schools example, we’re looking at how effective a test preparation program was across eight different schools. For each school, we have an estimated treatment effect (how much students’ scores improved) along with a standard error.
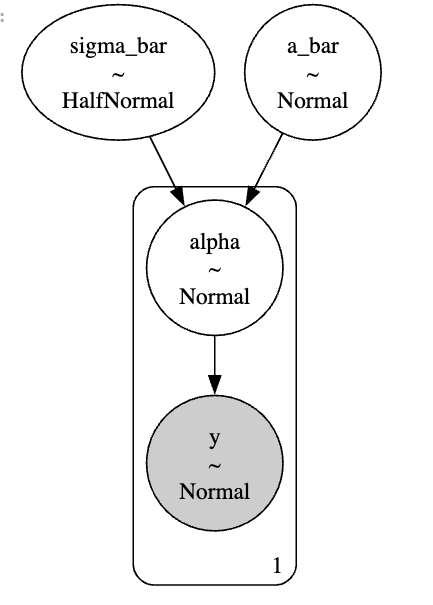
- \(y_i\) : is the observed treatment effect for school
- \(\alpha_i\) represents the true effect of the program in school which we don’t get to observe directly.
- \(\epsilon \sim \text{Normal}(0, \sigma)\) : is the observational noise or uncertainty in the data reported by each school.
Since we are fitting a bayesian Multilevel model, each random variable gets a prior. This is an important step and requires prior predictive simulations as a part of good bayesian workflow; but I am just getting away with some weakly informative prior to finish with this example.
How Memories are formed:
I’ve already run and fitted the model behind the scenes. If you’re curious about the details, you can check out the full PyMC implementation of the Eight Schools problem here. This lets us dive straight into what really matters: how adaptive memories are formed in models like this.
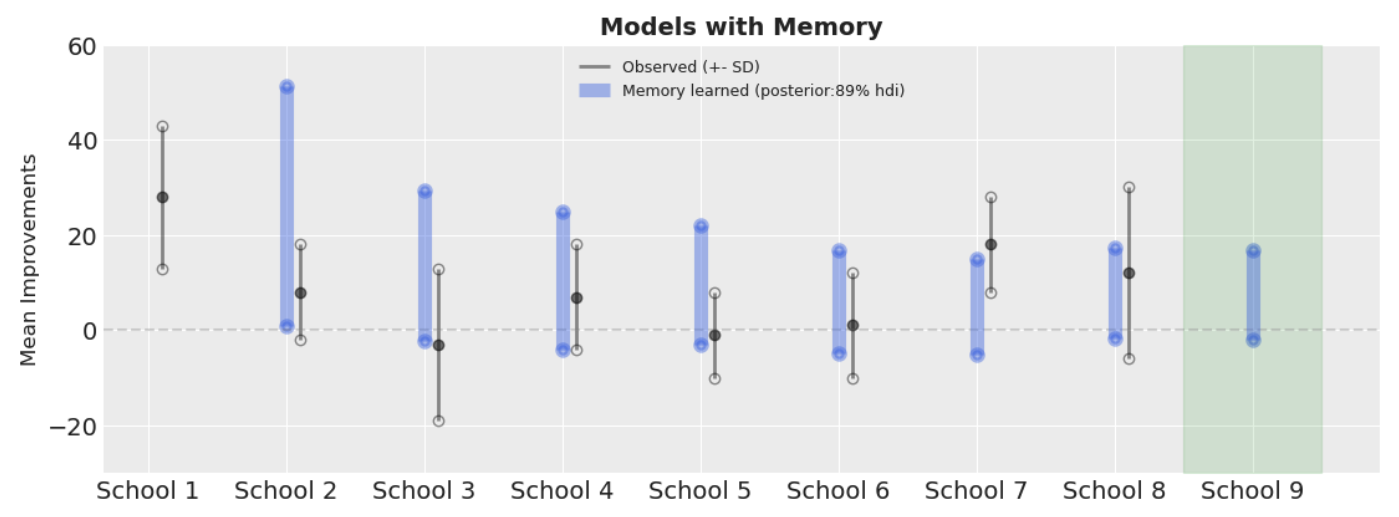
In the diagram (shown above), the blue solid lines represent the model’s memory evolving as we go from School 2 to School 8. The black solid line reflects the distribution of the observed data, and the green shaded region hints at a new, unobserved School 9.
There are 8 schools in our dataset, and let’s say we visit them one by one from School 1 (left) to School 8 (right). (I’ve fitted the model in that order.) When we begin with School 1, we have almost no information—aside from a vague prior (which, for now, we can assume is flat). So there’s no blue memory line at this point; it’s like encountering a completely new experience.
But as we collect data from School 1 and move through to Schools 2, 3, and beyond, we start accumulating knowledge. This accumulated “memory” for each subsequent school is reflected in the blue line, which becomes more informed with every school we visit.
By the time we reach School 8, we’ve formed a coherent and informed belief about the phenomenon. The model’s “memory” suggests that the average effect of the treatment—the improvement score—is most likely greater than 0, and probably less than 20. So when we finally look at a new school—School 9—even without seeing its data, our model is already equipped with a sensible, memory-based expectation.
⚠️ When Memory Misleads
Memory can be flawed sometime, model memory isn’t always perfect. If you over-rely on the past—pooling information from other groups too aggressively—you gotta be careful smoothing over important local differences. This is especially problematic when uniqueness matters. Imagine School 9 is in North Korea— a drastically different environment from the original eight schools. If the underlying conditions are fundamentally different, pooling data naively could lead to wildly inaccurate predictions as a result of inappropriate shrinkage. However this could be handled once you understand the domain and data at hand.
Also there are many things to be considered if you are making causal claims which comes as a challenge as explained in this paper - Multilevel (Hierarchical) Modeling: What It Can and Cannot
Conclusion
Despite these caveats,given no other information; multilevel models continue to be my go-to approach when analyzing grouped data. Their ability to perform partial pooling - forming an adaptive “memory” that balances group-specific and population-level information - is uniquely powerful in practice. This isn’t their only strength either; as I’ve explored in my previous post on handling overdispersion, these models offer elegant solutions to many common statistical challenges.
Other Resources
-
Everything I Needed to Know About Bayesian Statistics (Eight Schools) - Gelman
Classic case study demonstrating hierarchical Bayesian modeling -
Statistical Rethinking - McElreath
(See Chapter 13 for multilevel models)
-Statistical Rethining lecture
-
Bayesian Data Analysis - Gelman et al.
The standard Bayesian textbook reference -
Analysis of Variance: Why It Is More Important Than Ever - Gelman
- Multilevel (Hierarchical) Modeling: What It Can and Cannot
- Official PyMC Documentation
- Eight Schools Example in PyMC