Maximizing performance through incentives when volunteers vary
Purpose
Most organizations need to structure a reward system. A function of such a reward system is to select, implement and monitor incentive programs to increase productivity. A common notion is to believe that the incentives increase productivity for everyone. So keeping that in mind, should we provide incentives to everyone and expect a certain boost in performance for a certain project? Or cluster participants with some criteria. Furthermore, We can do better! We can increase the precision and effectiveness of the program with the existing data we have.
One of the criteria for selecting such programs depends on volunteers’ previous performances on different projects. But it is hard to generalize incentive strategies with historical performance because performance itself is an abstract term and varies by person, project, and time. However, we can model its variability and pool information because it also shares some common information.
Data & Methods
We choose \(N\) volunteers from different projects at random and observe their performance metrics before and after the incentive. This measure is calculated by averaging over different features that determine the contribution of each volunteer to a particular project. But, no matter how many features we include, there will always be unmeasured variation in these abstract measurements like performance. However, the model we will be using is inspired by the fact that we cannot control for all the variability.
Each row represents different projects. For this experiment, we use \(N=30\). And we let incentives be a fixed constant which does not vary by individual and let \(A\) be the event where the incentive is provided thus, indicator r.v. \(I_{A}\) is defined to be 1 if \(A\) occurs and 0 otherwise. And, \(P\) represents performance score by volunteers. Note, each row represents a project which we have selected to be similar in nature.
Implementation, Assumptions and Priors
We know that performance varies from person to person, and the effect of incentives also varies from person to person. We will start with a simple varying intercept and varying slope model. With this model, we are going to pool information from different clusters which vary. The distributions assigned to both intercepts and slopes enable pooling for both, as the model learns the prior from the data.
\[P_{i} \sim Normal(\mu_{i},\sigma)\] \[\mu_{i}=\alpha_{[pid]}+\beta_{[pid]} * A_{i}\]But we cannot still strongly generalize the relationship between performance and incentives. The generalization is important to us because we want to make predictions outside the sample. We do this by testing the fact that inexperienced volunteers will have less effect on their performance despite getting incentives compared to experienced ones from our data. The proxy to experience is captured by our performance metric but it doesn’t have to be only experience, it can be anything that drives performance.
So, we are implying that there may be a correlation between the intercept and the slopes which will further help us to squeeze more generalizable information out of the data.
\[\begin{bmatrix} \alpha \\ \beta \end{bmatrix} \sim MVNormal\left( \begin{bmatrix} \mu_{\alpha}\\ \mu_{\beta} \end{bmatrix},S \right)\]where,
\[S=\begin{bmatrix} \sigma_{\alpha}^2 & \sigma_{\alpha}.\sigma_{\beta}.\rho \\ \sigma_{\alpha}.\sigma_{\beta}.\rho & \sigma_{\beta}^2 \end{bmatrix}\]\(S\) is our variance-covariance matrix with shape 2 by 2. And from the properties of the variance-covariance matrix, the diagonal represents variances for \(\alpha\) and \(\beta\). Off-diagonal represents how these co-vary which we will be estimating. \(\rho\) here is also one of our parameters of interest which represents the correlation among performance and the effect of incentives.
Now the standard set of priors that would help us pool information and test our facts might be:
\[\mu_{\alpha} \sim Normal(2,1)\] \[\mu_{\beta} \sim Normal(0,0.5)\] \[\sigma_{\alpha} \sim Exponential(1)\] \[\sigma_{\beta} \sim Exponential(1)\] \[R \sim LKJcorr(2)\]where LKJcorr is the correlation matrix family of distributions described in Lewandowski et al. 2009.
Also, \(R\) is a matrix \(\begin{bmatrix} 1 & \rho \\ \rho & 1 \end{bmatrix}\) which is obtained by decomposing the variance-covariance matrix so that we could assign priors. —
Findings & Story
It would be unnecessary to display different parameters on a table because most of the parameters now interact and are now dependent on each other, so it would be best to represent the model with the plot below.
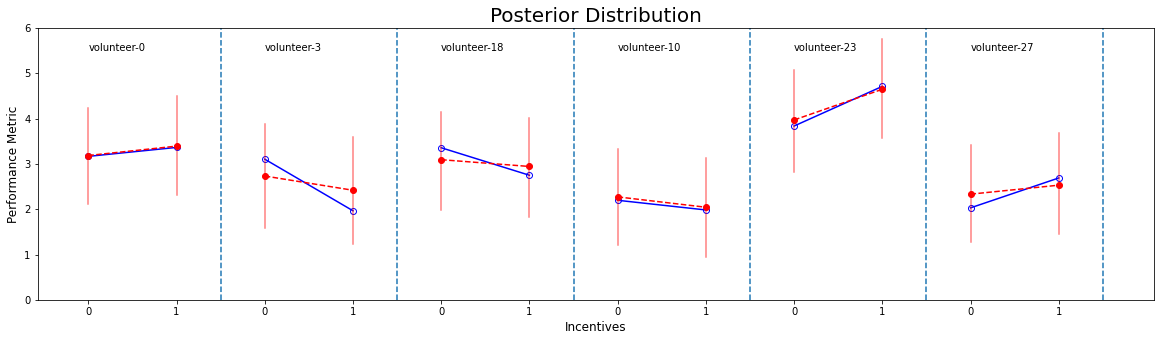
Fig 1.1; Posterior prediction: The performance score for with and without incentives by randomly selected volunteers. The blue line represents the raw data and the red dotted line represents the model.
One thing to notice here is that the model does not retrodict with the raw data; because the model has now learned the variation and correlation from different clusters that we have allowed through adaptive regularization. For example, volunteer-3’s performance decreased after incentives but the model suggests on the long run we are expected to see no effect. Again, he/she would have not liked the incentives in the first place that it had a truly negative impact on his/her performance but we are not interested in a person-specific performance from this study rather we would like to predict outside the sample.
Also, we expect some shrinkage in our prediction, but now the shrinkage is in two directions (Explained in the plot below). This means that there is some correlation between the performance of a volunteer with its effect on incentives which is on average \(0.7\). So as the volunteer who performs well will perform even better with incentives as opposed to the ones who perform below average. The results are quite typical as expected. But now we can generalize it more profoundly with the help of our model.
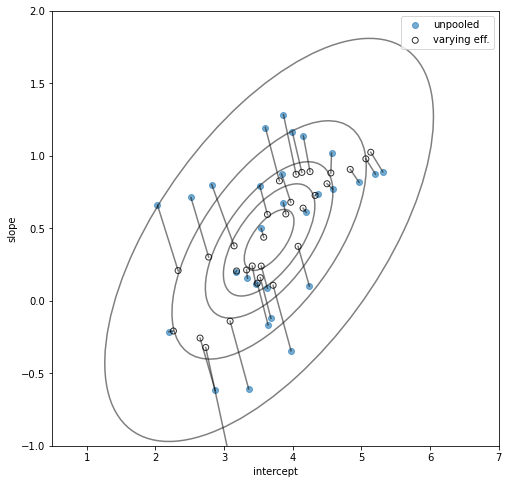
Fig:Shrinkage in 2-Dimension, for both intercept and slope
So to summarize this as a story; volunteers join our organization and are assigned to different projects through some processes. Not all volunteers are productive and can contribute to our project goals; this can be measured with some project-specific performance metrics which vary by different factors. So to answer our hypothesis; Will incentives improve their performance? The answer to that is it depends. It depends on how he/she performs in the first place. There is a positive correlation between the actual performance with the effect of incentives. This also makes intuitive sense that if a person who lacks skill or experience will not manage to improve his/her performance even if he/she wanted to.